Do You Have an Ideal Clinical Dashboard?
SUMMARY:
Data drives much of healthcare, but more data does not always mean better and more actionable insights.
Clinical Dashboards highlight the most important trends and results for clinicians to allow them to engage in change.
Clinical dashboards need to ensure the correct data is measured and displayed without too much “noise” (irrelevant or too much data).
REVIEW
The Purpose of a Clinical Dashboard is to Provide Insight into 3 Categories:
Performance Improvement on practice areas to address
Quality and Safety – track agreed upon clinical guidelines and benchmarks
Management and Operations – department level data to support day to day functions and care services
The Value of Clinical Dashboards are to:
Integrate disparate and poorly organized data into an easy to understand format.
Aggregate data into a centralized location
Highlight the essential metrics for greatest opportunity of improvement based on important trends.
Goals of a Clinical Dashboard are to Easily Depict:
What happened
Why it happened
What may happen
What action should be taken
Your ideal dashboard should be able to answer all of the above items
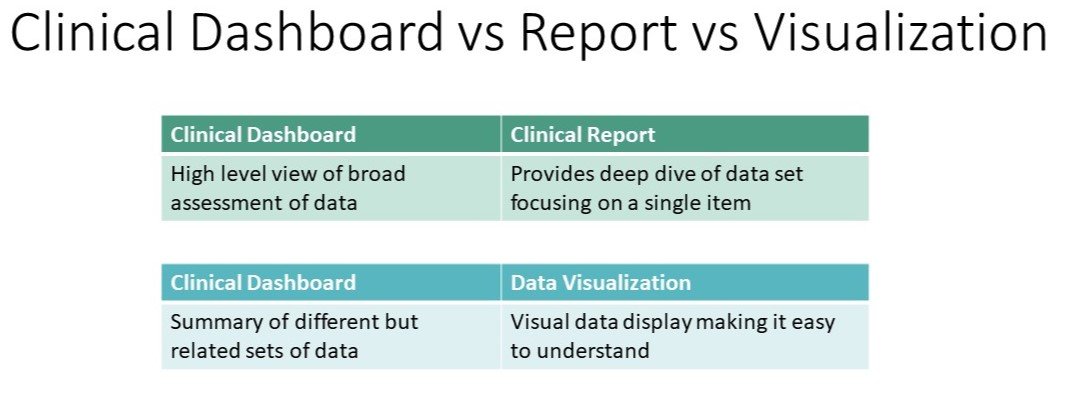
Differences between a dashboart, detailed report and data visualization
Ideal Clinical Dashboard
1. Can the dashboard provide easily assessable quality clinical data?
Assess the need to maintain or change clinical direction
Provide the correct fidelity of data (volume, frequency, duration of collection) to draw conclusions
Is the data presented as patient disease severity adjusted allowing cross unit comparisons
2. Appropriate format of current comparisons used within the dashboard
Benchmark:
Useful to compare one site to another
Should highlight a change in direction
Historic Comparisons – evaluate data delivered in the recent past
Standards are met:
Used to assess quality of care expectations
Based on standards from accreditation body, own organization goals, or both.
Compare your performance data to agreed upon goals
3. Control Charts
·Helps to identify data outside an accepted zone
Typically classified as excellent; acceptable; needs follow up
Common Clinical Dashboard Mistakes:
Lack of real time or high quality data
Clear goal(s) of Dashboard not established
Too many KPIs per Dashboard
Incorrect representation of data
Cluttered, confusing or too much data
Lack of patient severity adjustment to compare across
Data not grouped logically
Ideal Dashboard Design Considerations:
Meaningful/actionable data and insights to provider
Clinical indicators based on widely accepted, published standards/guidelines
Couple reported data with other relevant information:
Patient context
Predictive algorithms
Clinical decision support algorithms
·Easily interpreted performance data of individual or team performance
CONCLUSIONS:
Clinical dashboards take data from different sources and aggregate them into easy to read and interpret insights.
When done correctly, clinical dashboards area useful for monitoring, measuring and analyzing relevant data.

